Emotional analysis tool for test creators
Sharewell is proud to present a new tool for test creators: emotional analysis. Although still in beta, this addition helps researchers and designers understand how testers react to presented tasks and products.
Why have we developed this tool? Well, we are constantly asking for input from test creators about the tools they need or already use. Ability to track emotional response has been one of these tools – some already use it, others are interested in using it due to the data it provides. When showing new developments or creating tasks for studies, you can take emotional analysis into account.
One might want to see how different site tools like search engines or navigation menus might influence emotions. As we have seen from our bank sites’ study, people do tend to become frustrated quite easily when they run into obstacles. Having inquired the input ourselves, this tool helps with understanding users’ emotions. But this doesn’t necessarily mean it will solve the problem of constantly asking testers on how they feel. Still ask about their initial reactions, but now you can also use emotional analysis for further research.
How does it work?
Emotional analysis tool uses face-tracking software to read the emotional responses testers show and evaluate the intensity of these responses. By separating these emotions into several groups, test creators can easily select an emotion and see how it panned out throughout the test.
Test creators can access this new tool after a session has concluded. The emotional analysis tool is available as a separate tab under the overview of the session you want to analyze.

After opening this tab, you’ll see a colourful graph. This graph shows the entire duration of the test session containing emotional data and how these emotions developed as time went by. The entire map looks like this:
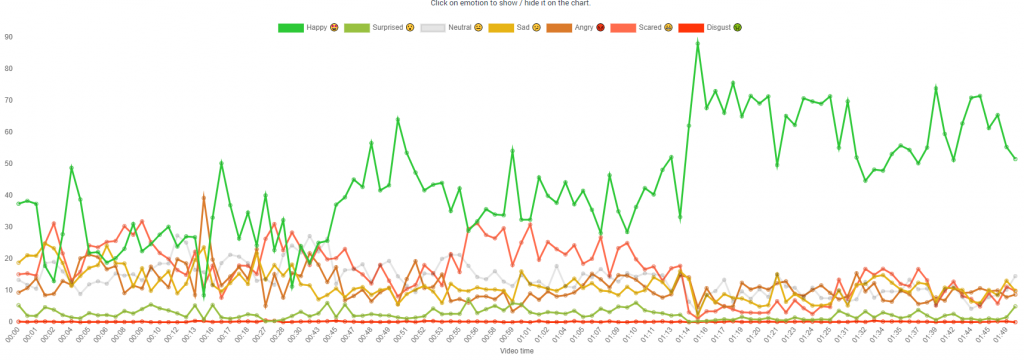
The graph describes multiple things here. The horizontal axis shows the duration of the session or video time – each second of the test session is shown here. The vertical axis shows you the intensity of emotional response.
What does this intensity of emotional response mean? As stated before, emotions are measured on their intensity throughout the session. Our facial expression tracking software looks at the webcam feed from the session and evaluates if the emotion was present as well as the intensity of it. Because we tend to show a variety of emotions at any given second, there are multiple emotions present at all times, some are more intense than others. We evaluate the intensity in percentages.
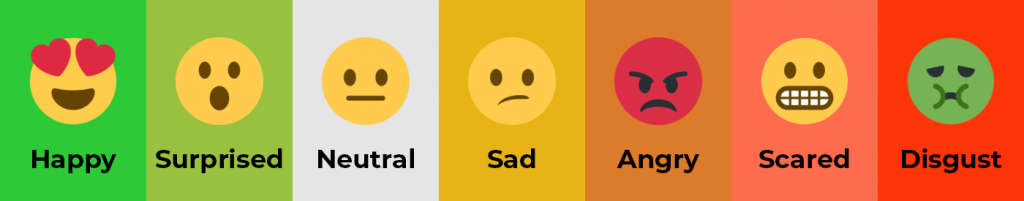
The emotions are categorized into seven different groups – happy, surprised, neutral, sad, angry, scared, disgust.
Because it is quite hard to analyze these emotions separately from this data-heavy graph, we have made it possible to select deselect some of the emotions for easier comparison. This can be done by clicking one of the emotion bars on top of the graph. Not shown emotions will be crossed out. It will look like this:
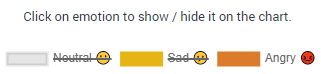
You can also save suitable graph views as separate images for your own personal use.
Final notes
To re-iterate, this tool is still in beta. We have launched the emotional analysis tool for test creators to use it in their next project, and see if they find it useful in the state it is at the moment. Any feedback on how to make the tool more accessible or user friendly is warmly welcome. Feel free to give criticisms by sending us an e-mail at info@sharewell.eu
This is one of the many features our toolkit provides. Read more on what Sharewell can provide to user researchers and other professionals: